Assessing ITP’s Effect On Adobe Analytics Data


Apple’s Intelligent Tracking Prevention (ITP) has been around for several years now. The goal, to intelligently prevent tracking, has sent ripple effects through the adtech and martech industries, affecting nearly every company with a digital experience whether they know it or not.
There has, until recently, been a lack of clarity on how to properly assess the effects of these browser-driven cookie changes driven by one company’s need to prioritize privacy for their customers.
3rd party cookies were killed by Safari, then on all browsers on iOS. Firefox and Edge and Chrome (eventually) are going 💀 to 3rd party cookies.
1st party cookies set by JavaScript were then affected with shorter expirations, maxing out at 7 days in Safari and iOS.
CNAME and Adtech-driven cookies were yet another nail in the coffin, with 1st party cookies with expirations as short as 24 hours.
You’re probably wondering: How have all of these changes affected my business’s data?
Fear not, Adobe has your back. When ITP came for JavaScript cookies in February of 2019, we released adobe.ly/itp to help customers begin to migrate to a CNAME, server-side set first party cookie. When ITP then limited the length (and usefulness of cookies set via CNAME) at the end of 2020, Adobe began developing new technologies and strategies to mitigate the effects.
I’m excited to share that you now have a way to assess the impact of these ITP-driven changes. Every Adobe Analytics customer now has a new Workspace Template in their arsenal. Let me show you how to access it and touch upon a few of the highlights:
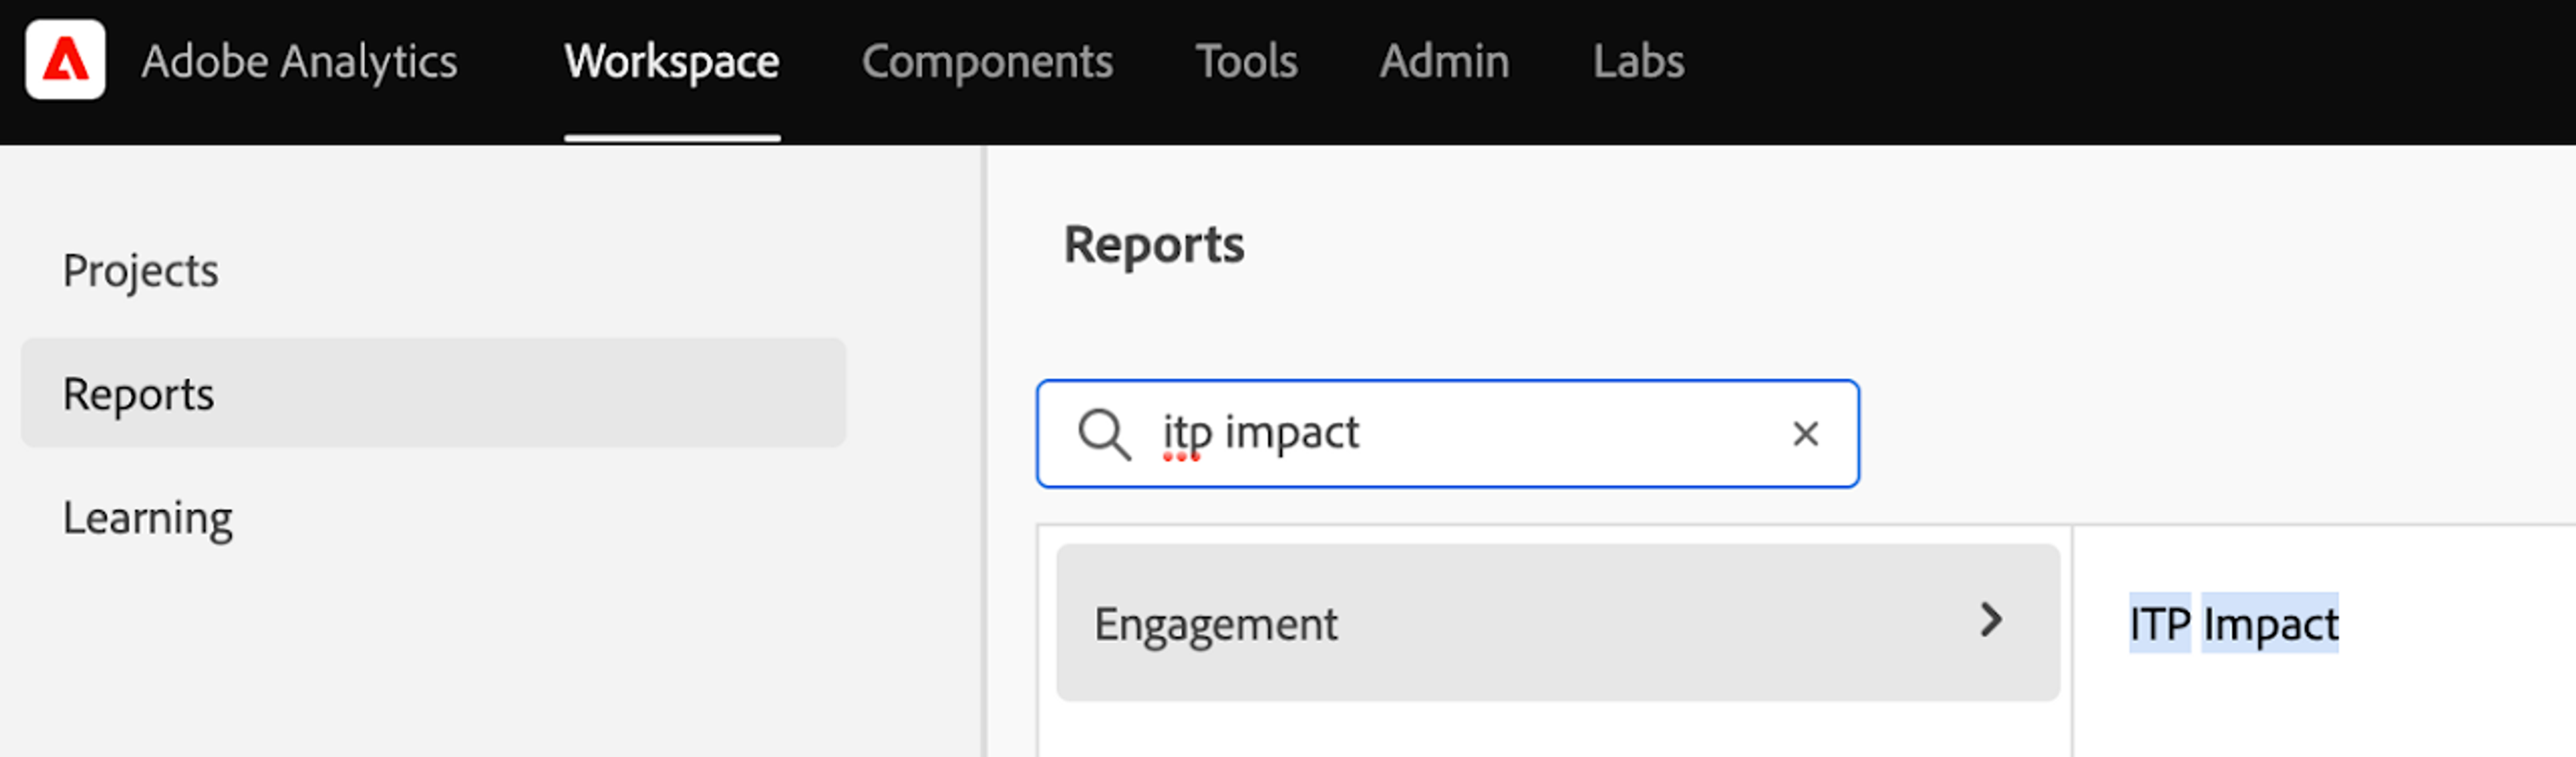
1. Open the ITP Impact template in Analysis Workspace. Click Reports from the Workspace homepage, then search for ITP Impact to find the template.
2. Once you’ve got the ITP Impact template open, you’ll see a number of Panels with data accessible to be applied to any of your report suites.
Hint: make sure you have selected a production report suite :)
3. The Introduction Panel will provide an even more thorough history of ITP than what I’ve written above.
4. The Understand: How many users are using an ITP-impacted browser? Panel will help you understand how many of your visitors are using browsers that have been affected by ITP, to the best of Adobe’s abilities. It’s a pretty thorough segment that is worth combing through to see how we’ve focused on iOS and Safari browsers.
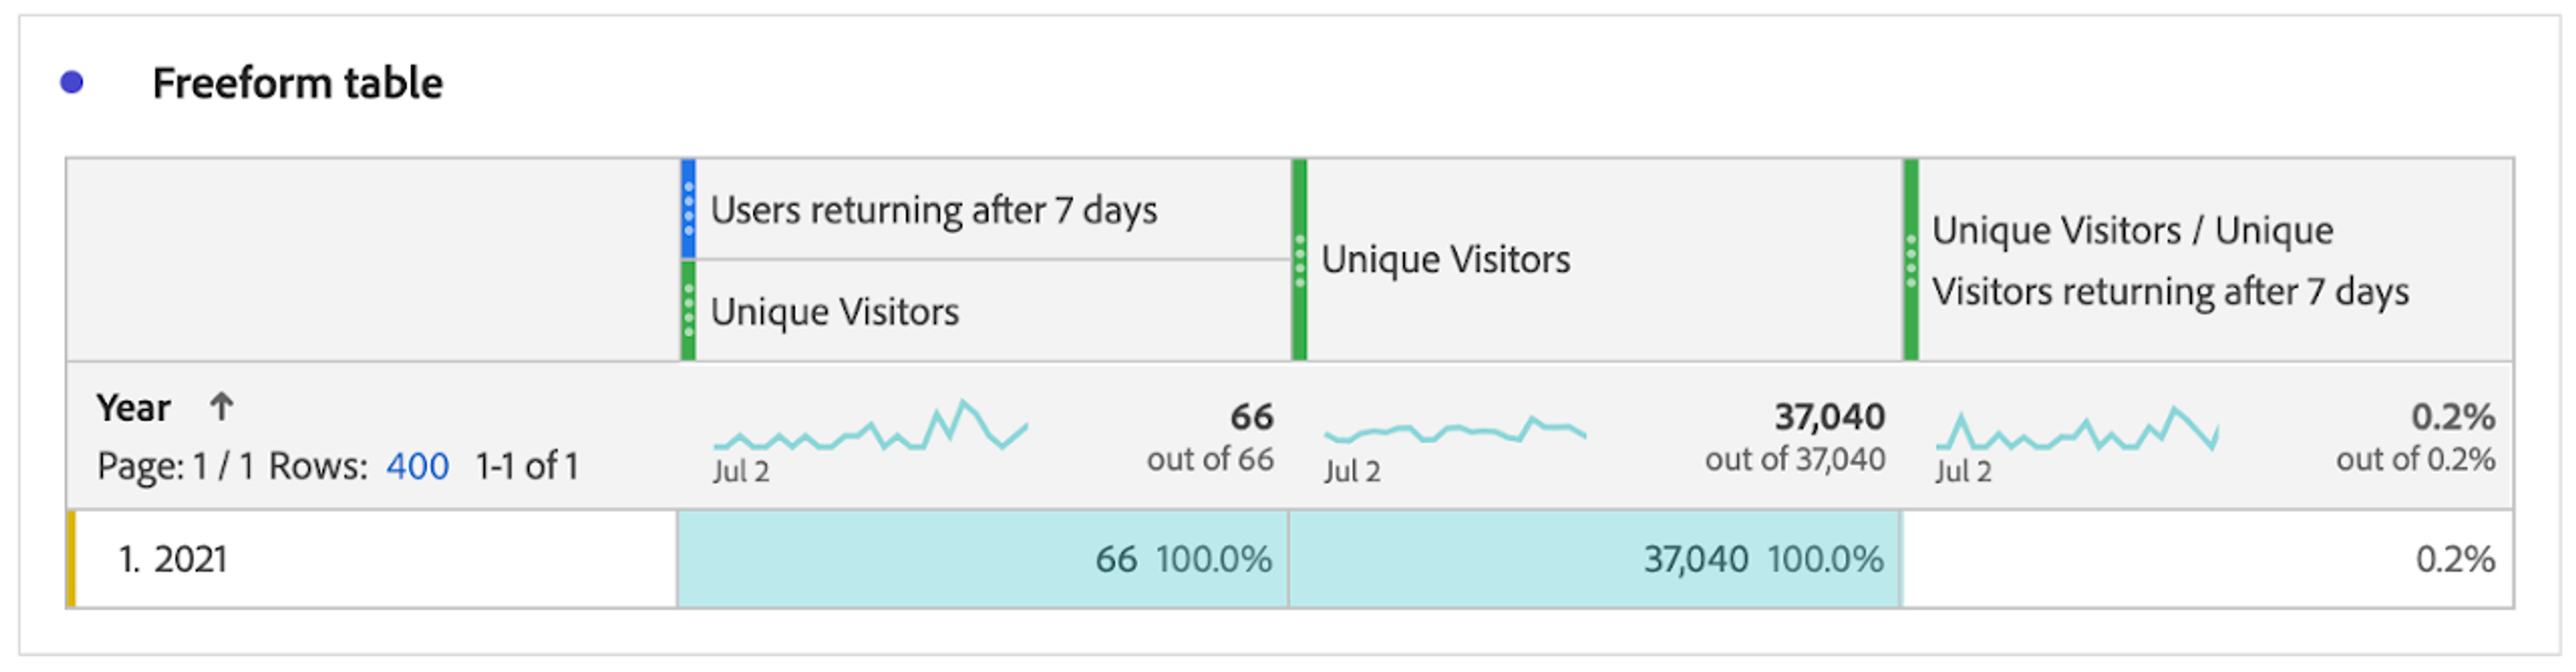
5. The Understand: How many visitors return after 7 days? Panel shows you details about non-ITP-affected visitors (ie — Chrome browsers). This provides a feel for how often your visitors return to your site without the limits imposed by ITP.
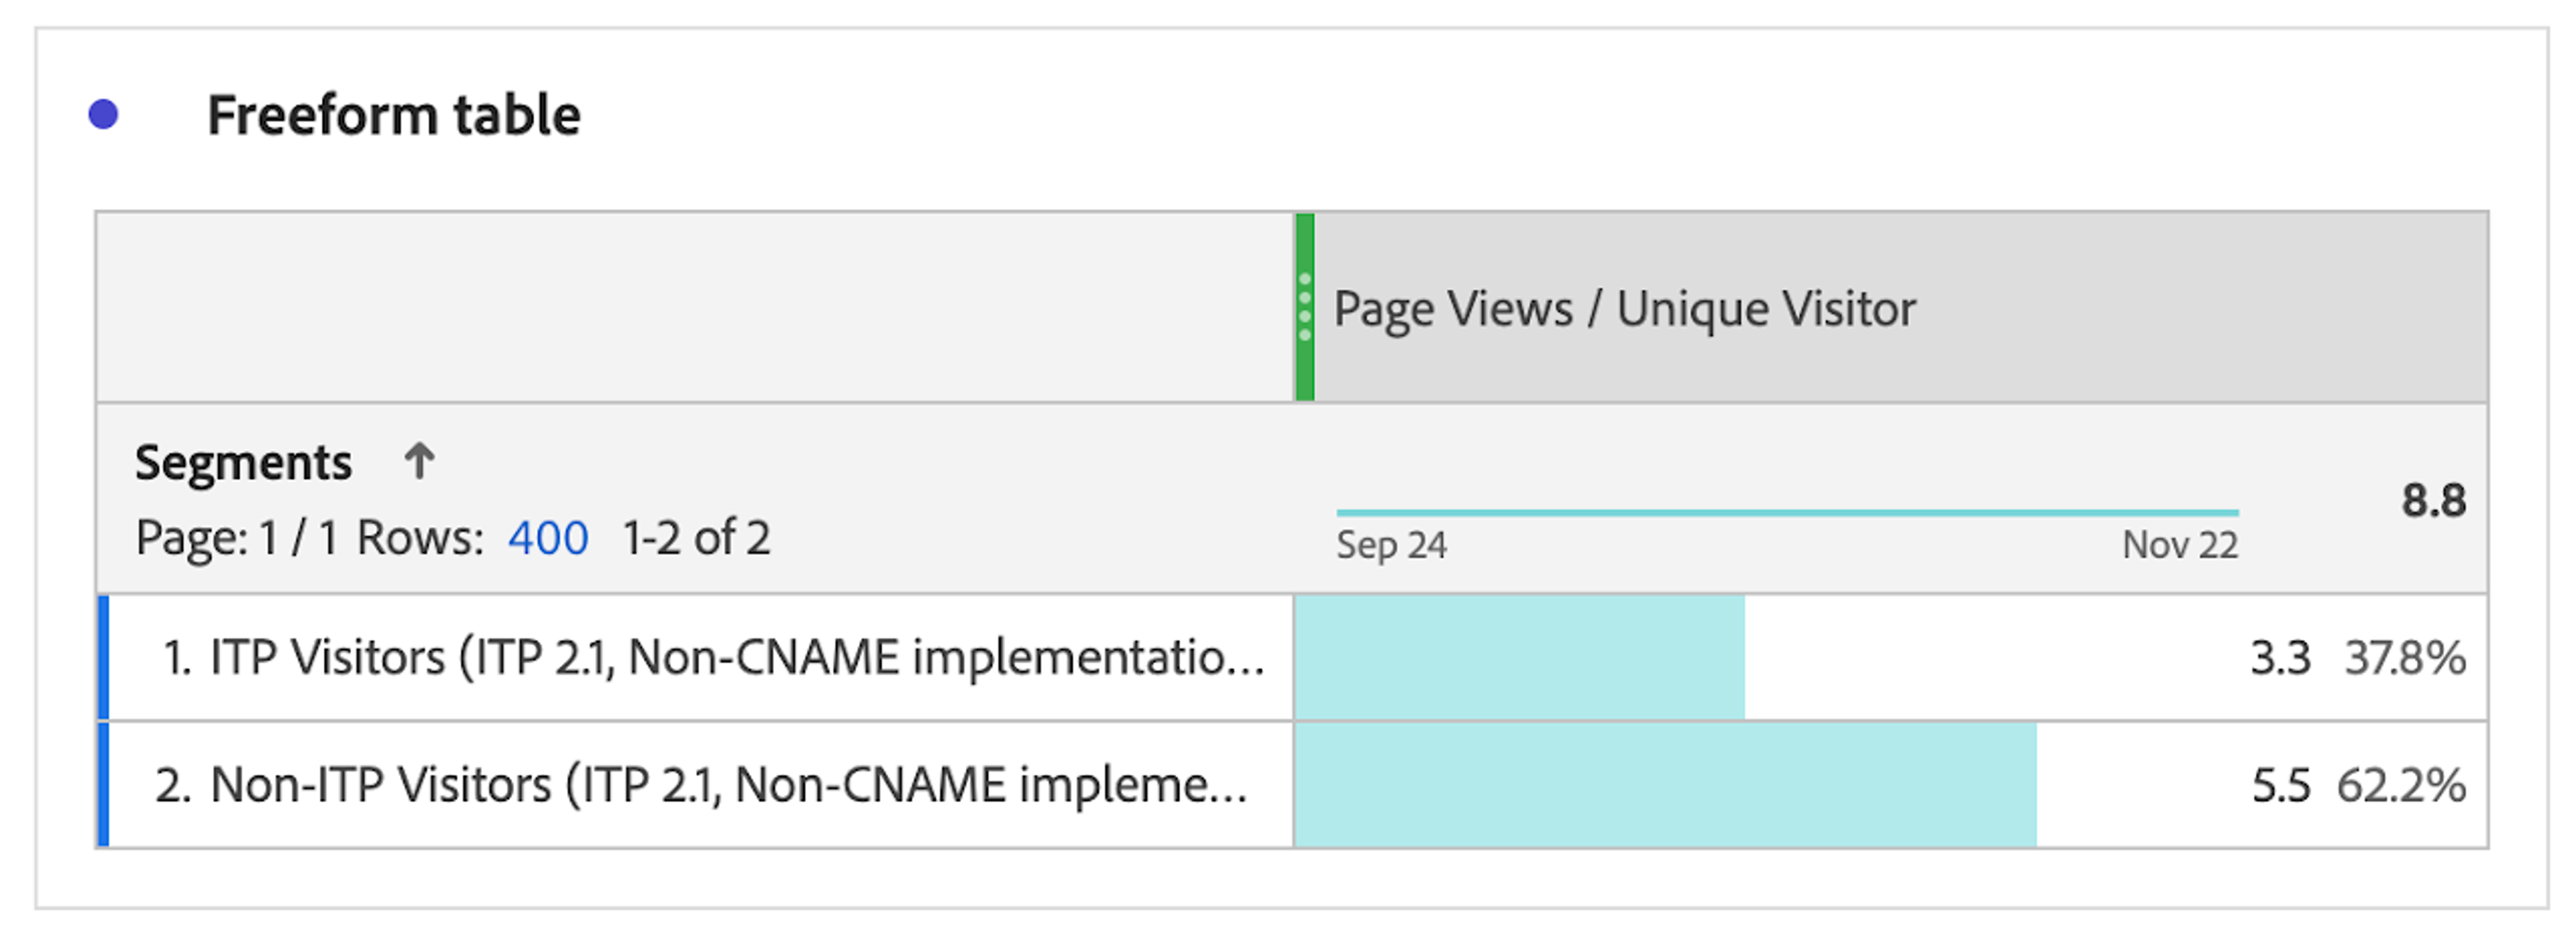
6. The Understand: Impact of ITP on Conversion Rate Panel provides a framework for you to quickly assess how ITP has affected your conversion rate. Note that by default, we show Page Views / Unique Visitor, but you can simply drag and drop different Conversion Rate metrics to the table to see how the ITP-driven increase in Unique Visitors (the denominator) causes a decrease in Conversion Rate.
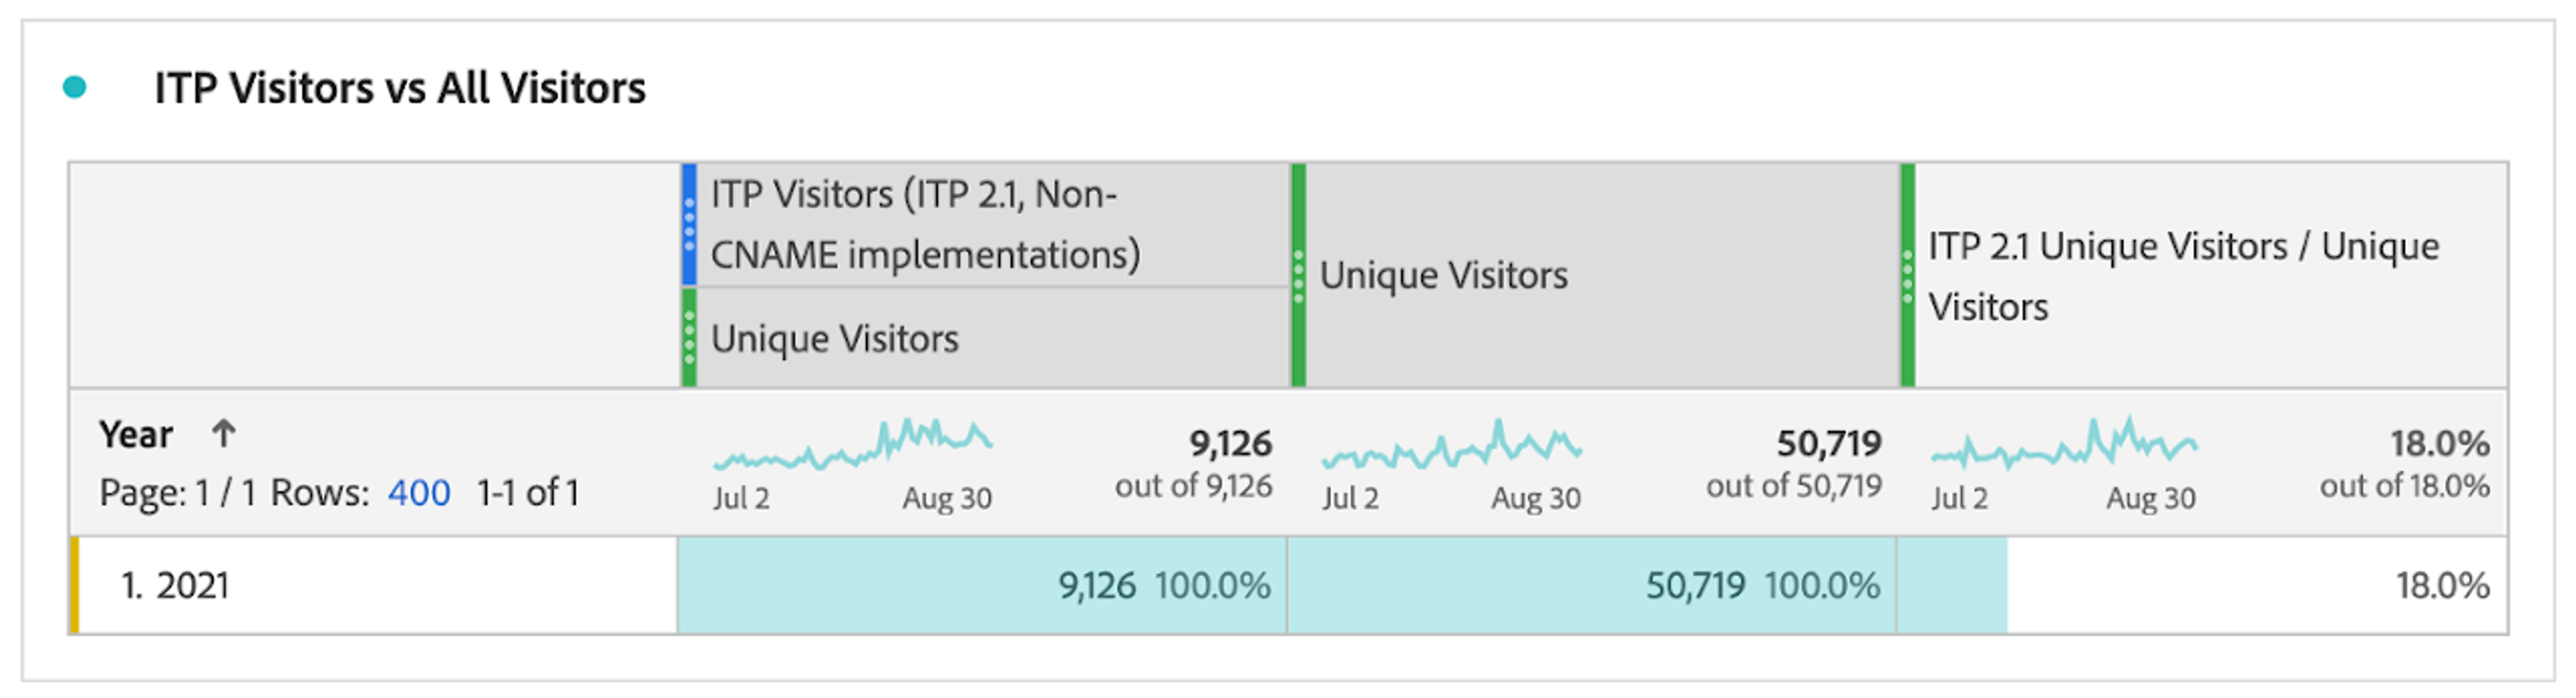
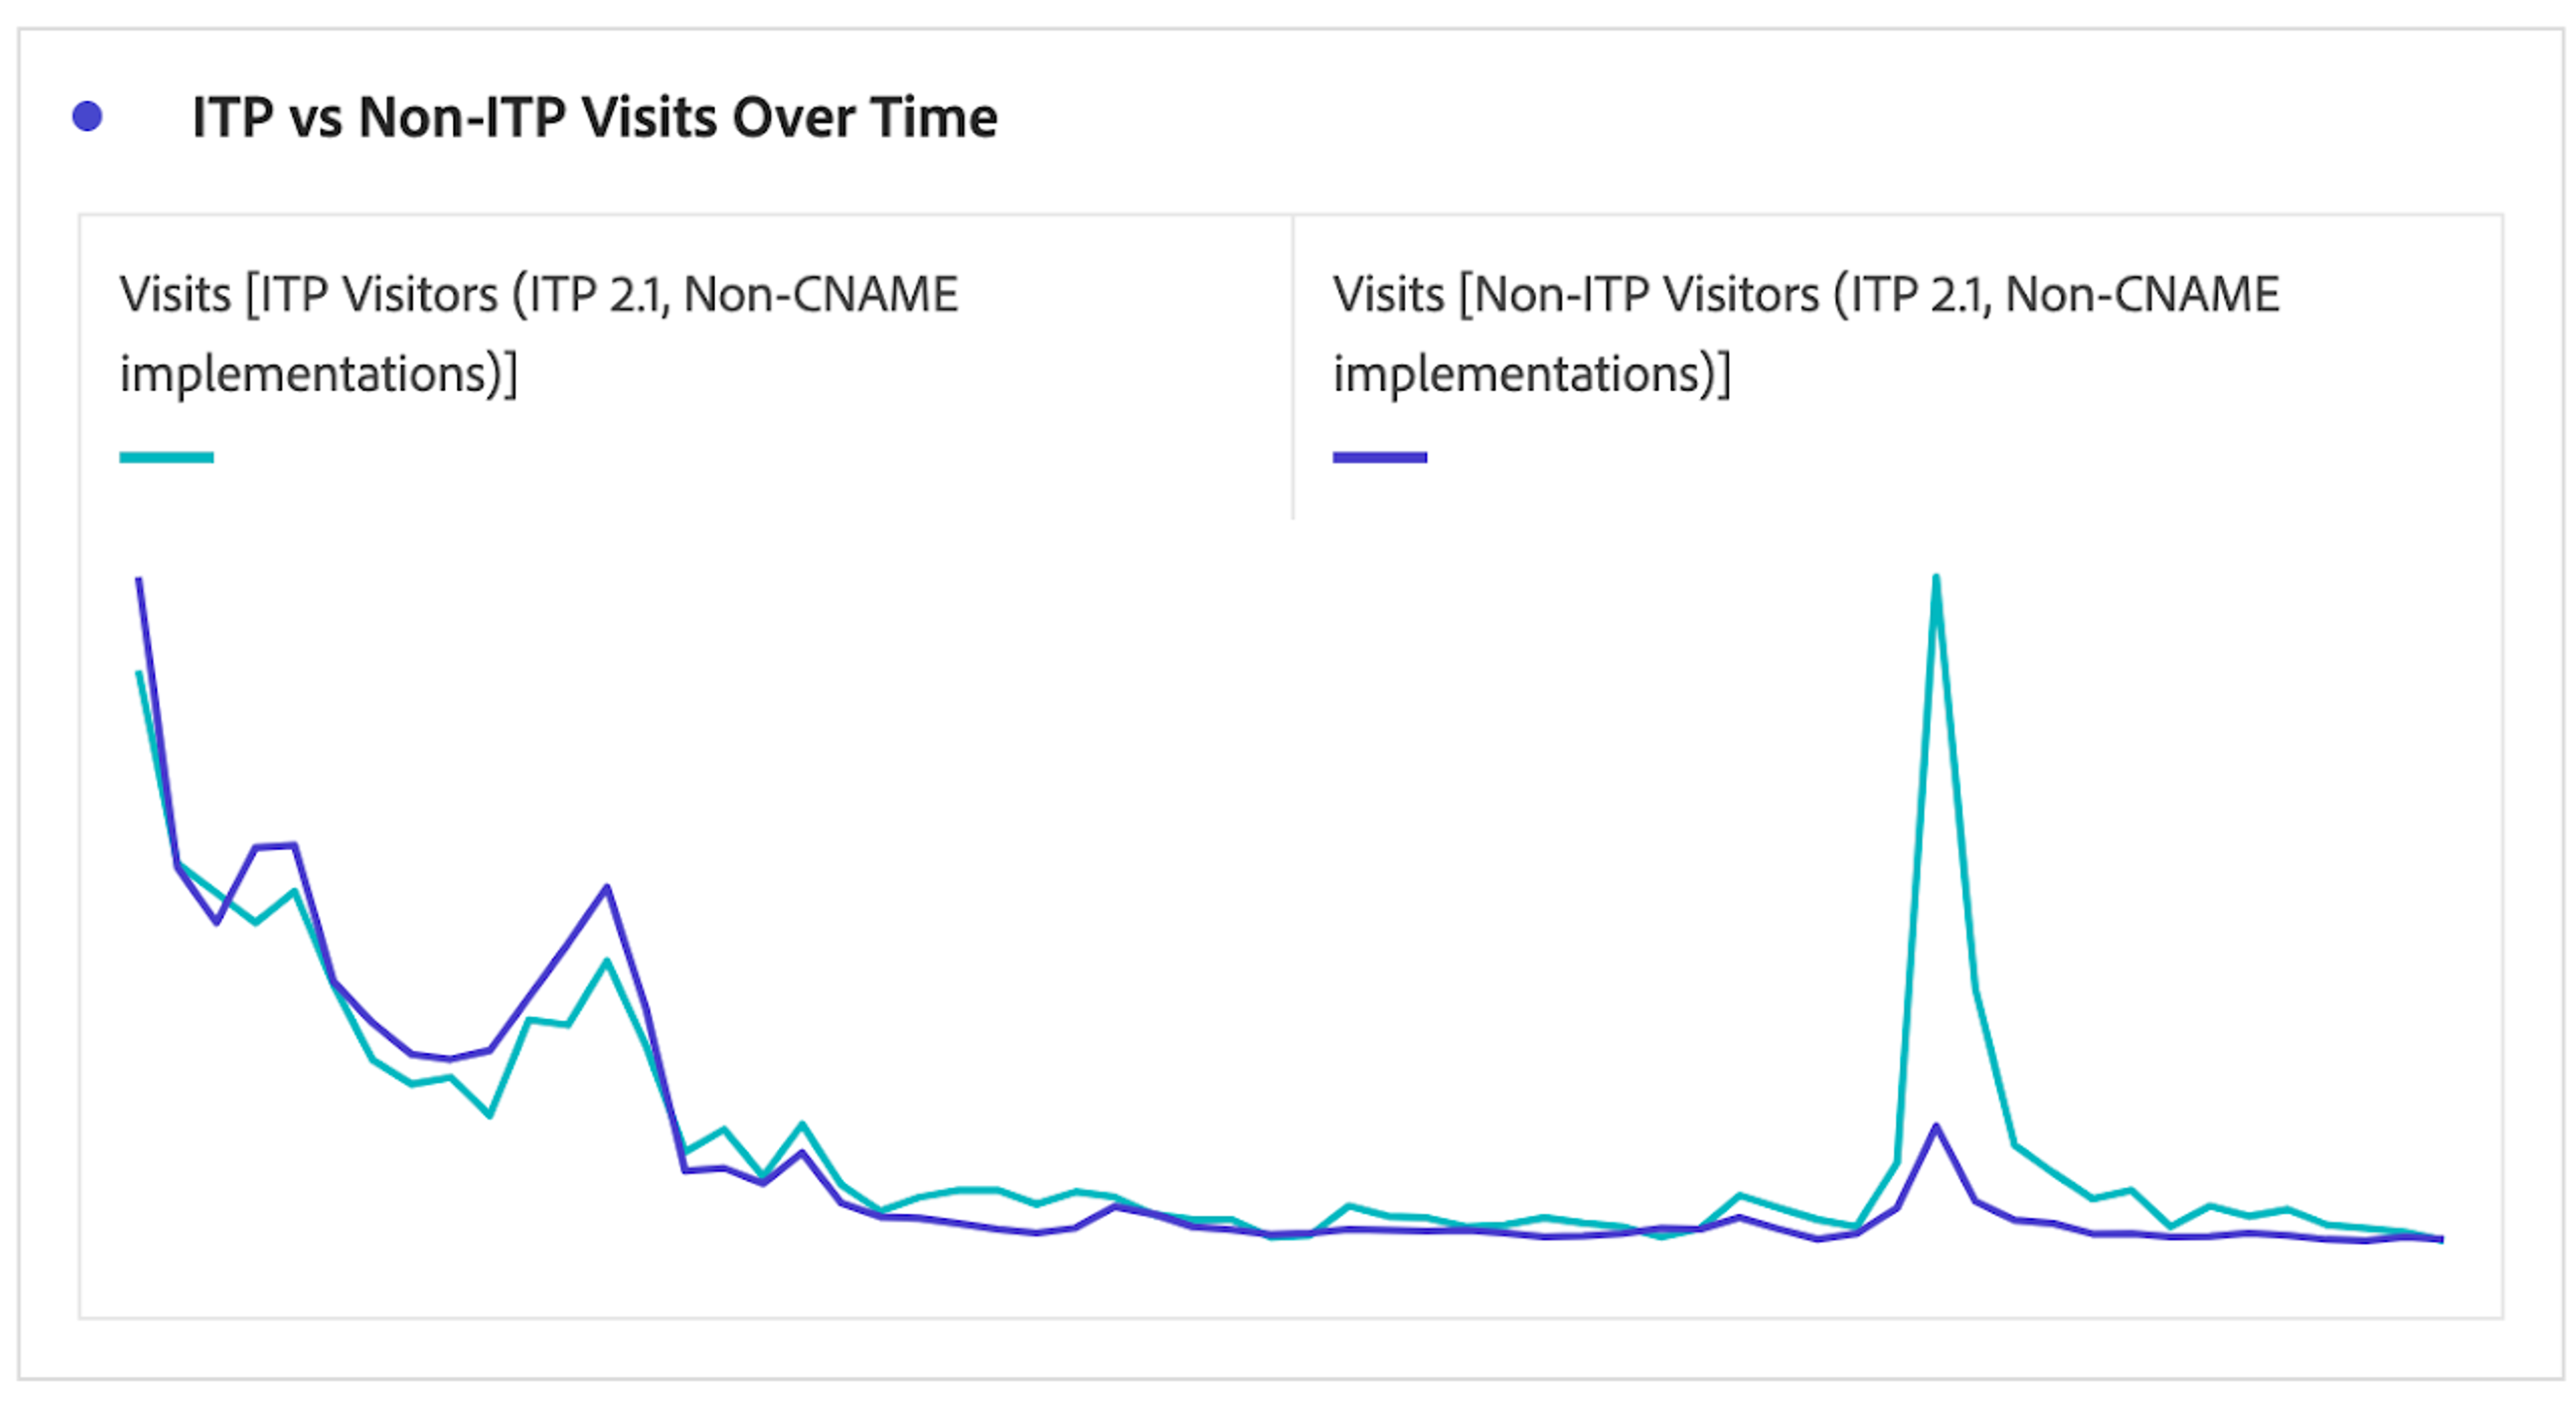
7. The Understand: Estimate Unique Visitor Inflation on ITP browsers Panel helps you to assess the amount of Visitor inflation due to the decreased expiration of first-party cookies in browsers affected by ITP. If you haven’t already performed this analysis, it may be interesting to see how this data compares to the same metrics prior to ITP 2.1 taking effect (February 2019). Keep in mind that the availability of this data depends on your company’s data retention policy. Most Adobe Analytics customers utilize the default 25 month retention policy, which unfortunately means that you may not have data from early 2019/late 2018 available in Analysis Workspace. If you’ve been backing this data up in internal systems and data lakes, now may be a time to use it.

Consider adding Visits to this table and trending ITP vs Non-ITP Visits to feel confident that there haven’t been any significant, recent changes to one browser type to another.
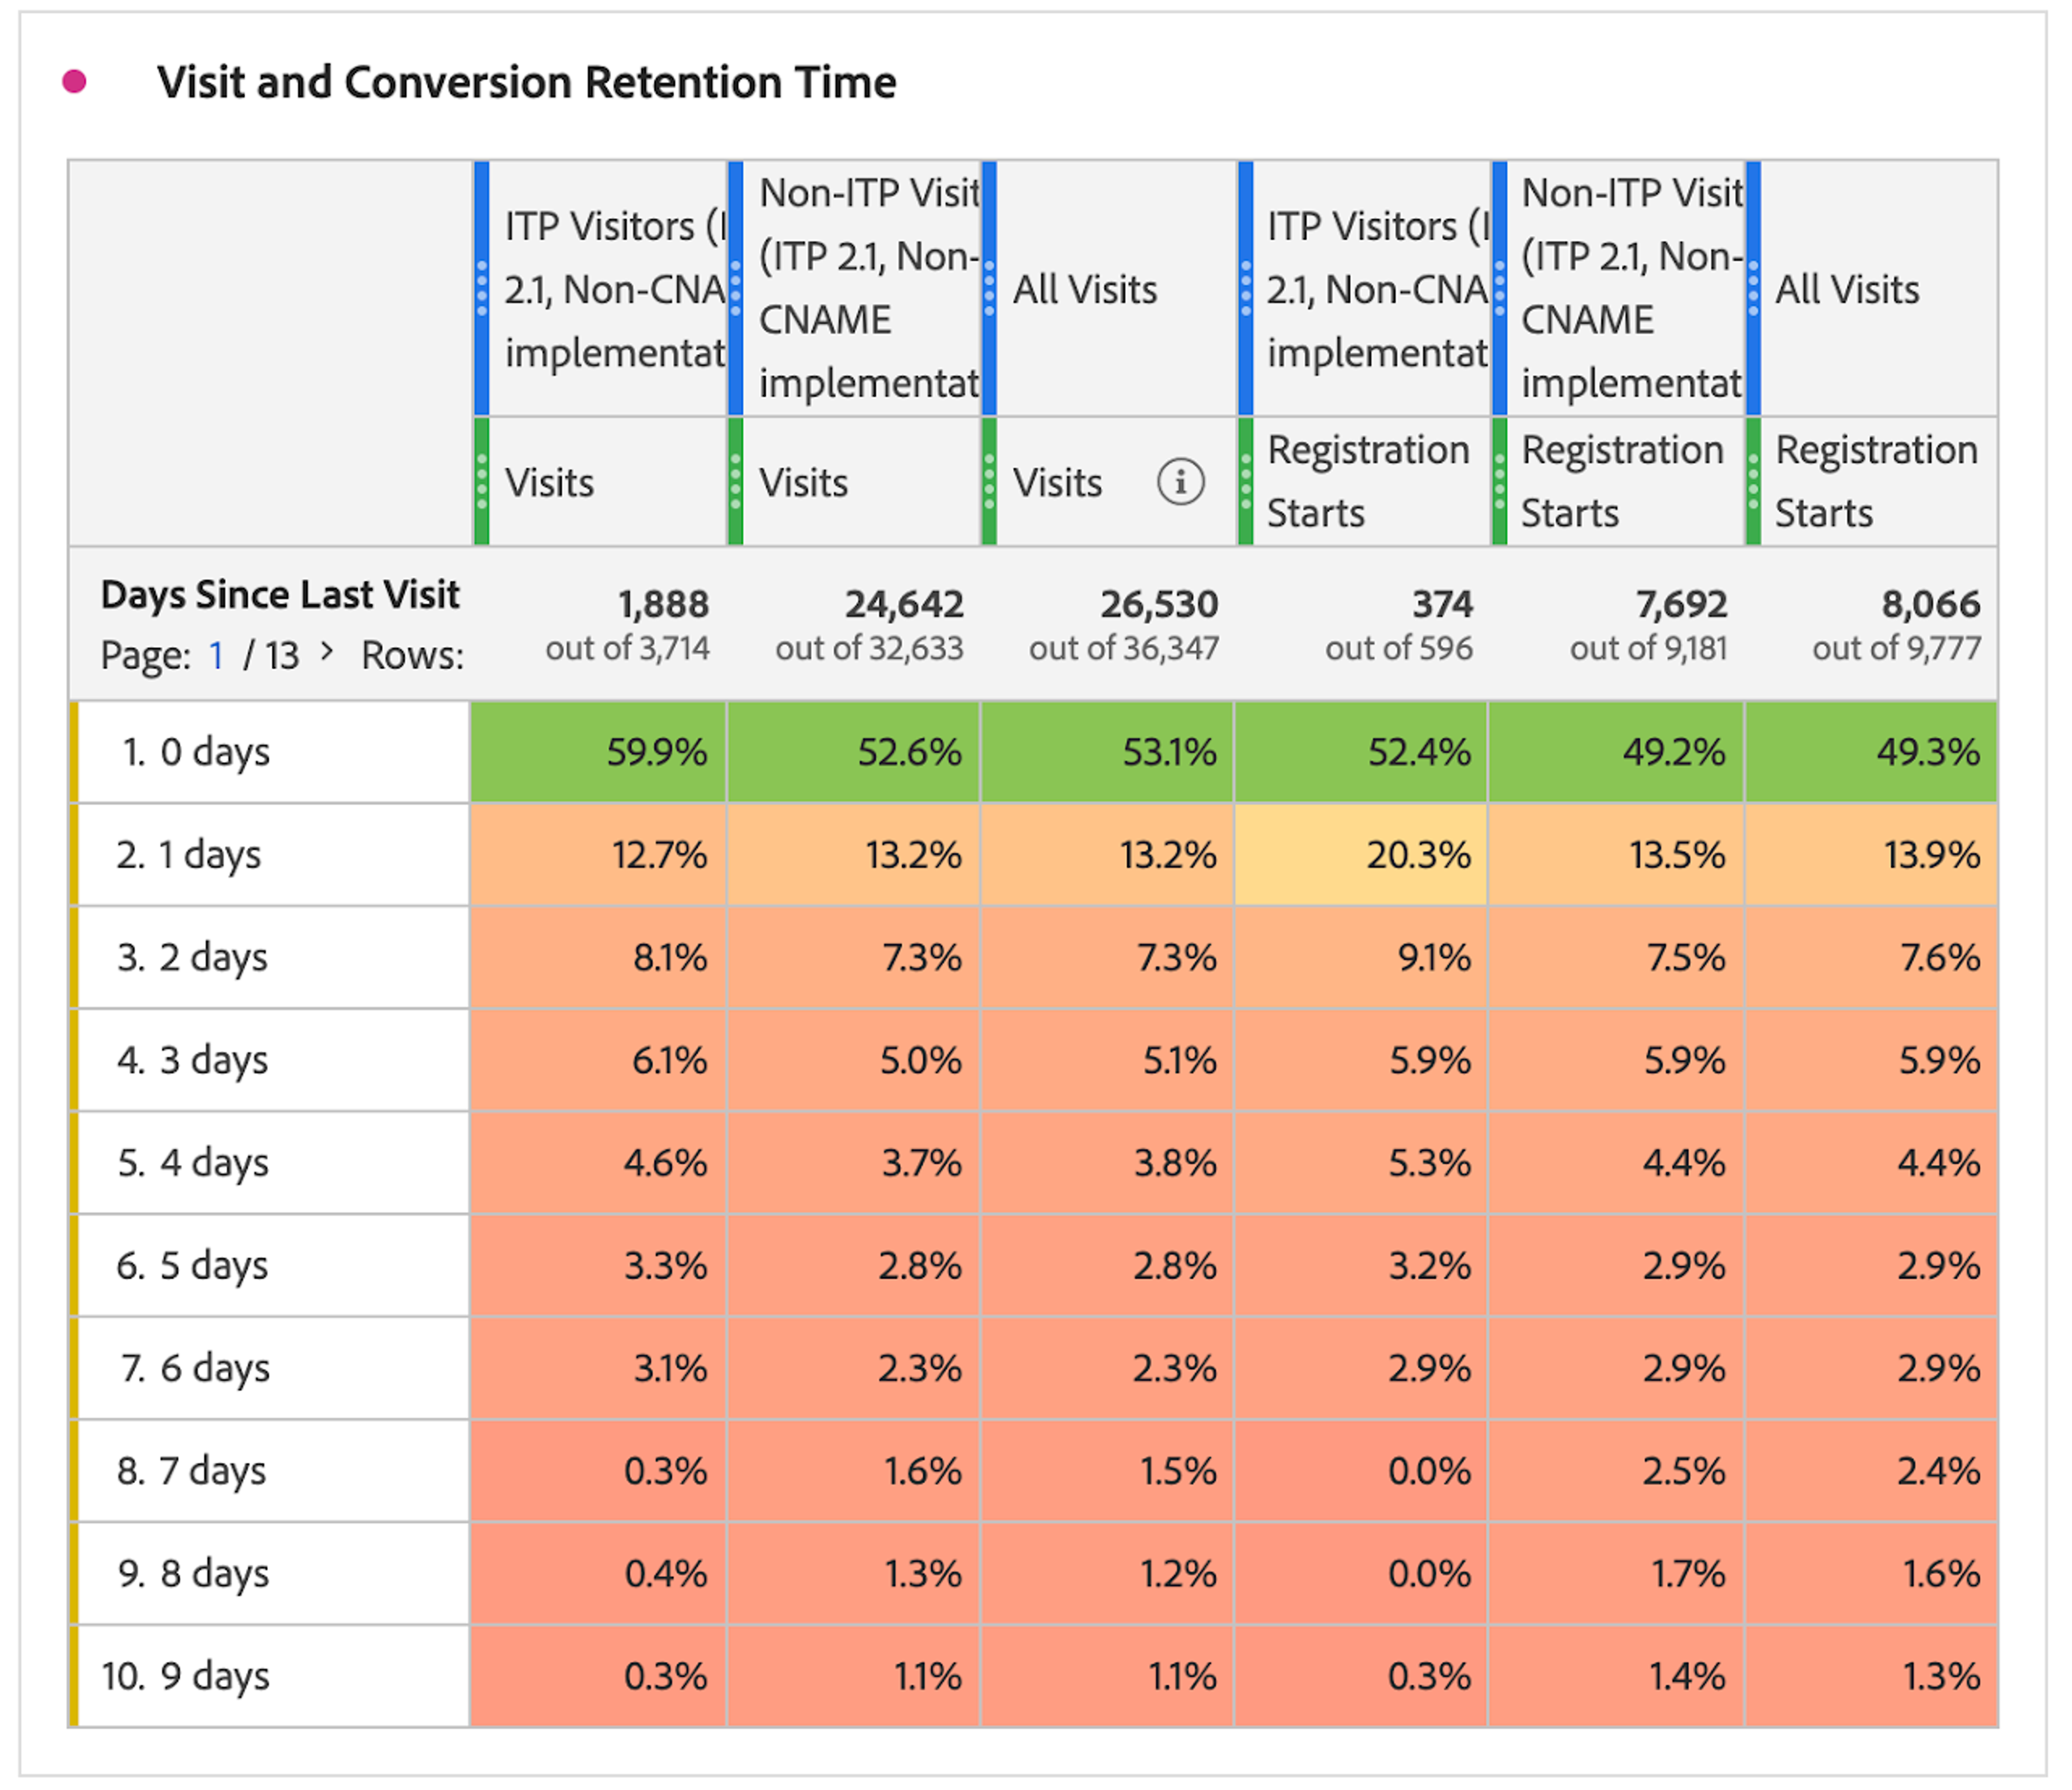
8. The Understand: Days since last Visit Panel provides you with a more granular view into how time data is affected by ITP. The Days Since Last Visit dimension identifies the time passed between the most recent and immediately previous visit. I find the default freeform table for this visualization to be helpful, but I love to expand it by adding Non-ITP Visitor and All Visits segments. You could even consider adding conversions as a metric here to again see how ITP is affecting conversion data from week to week.
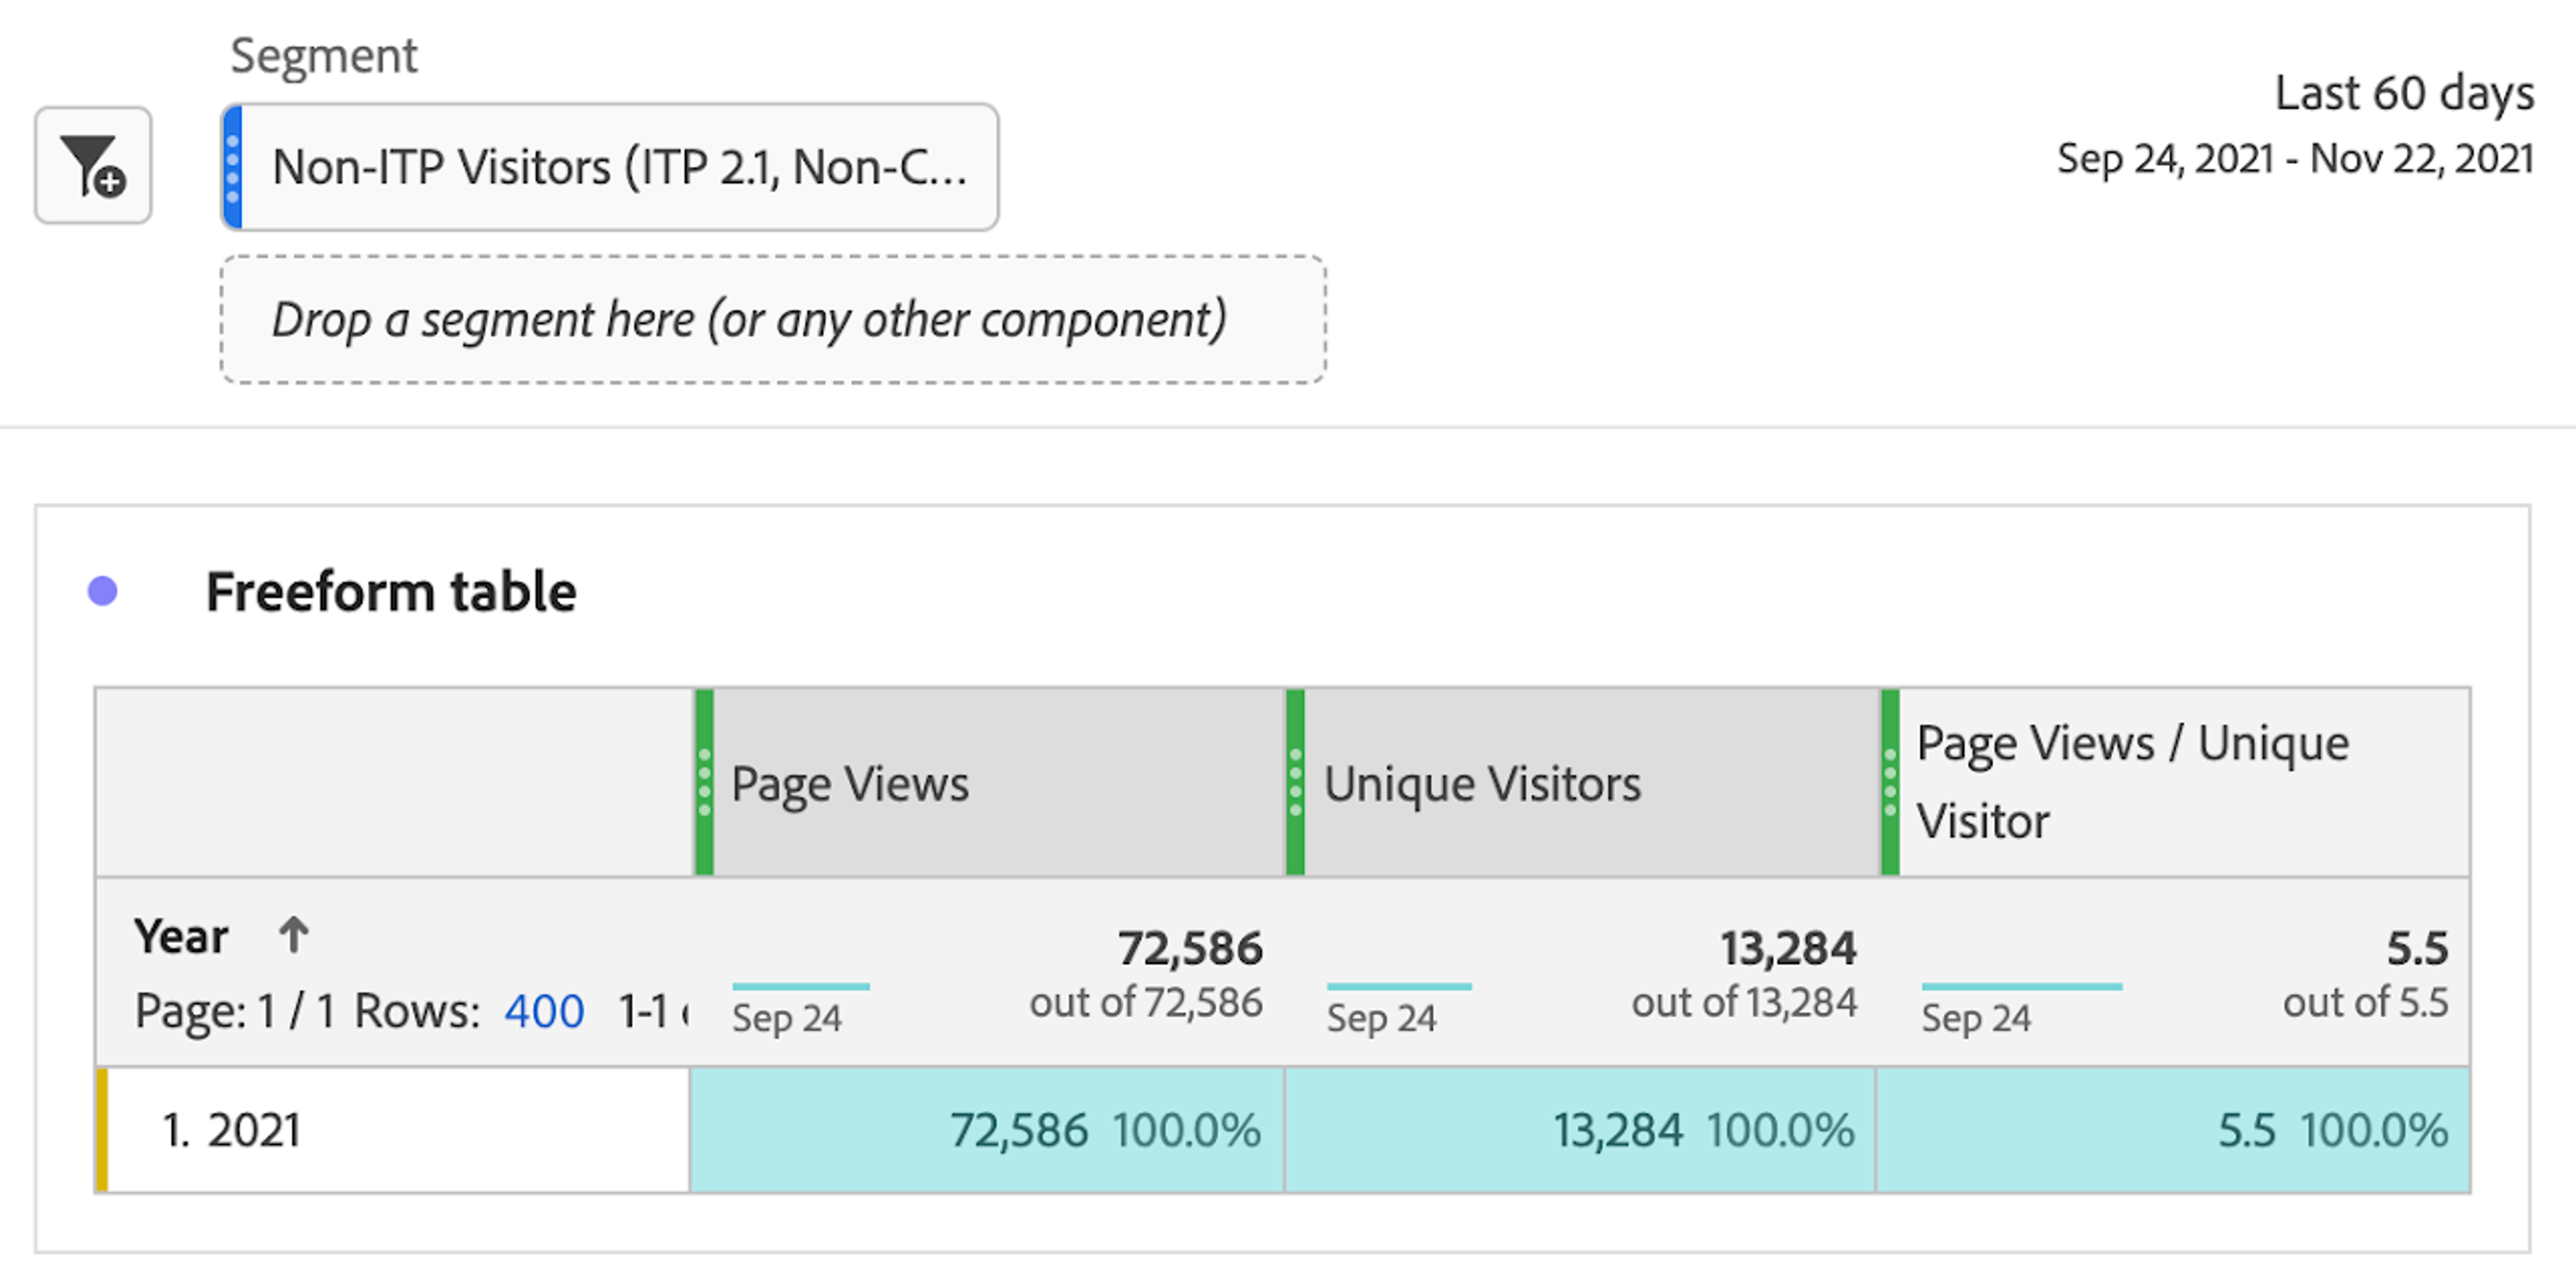
9. The Adjust: View only data unaffected by ITP Panel provides you with a playground to analyze data in your report suite that has not been affected by ITP. We’ve seen some customers take this to the next level by creating a Virtual Report Suite that focuses on this data.
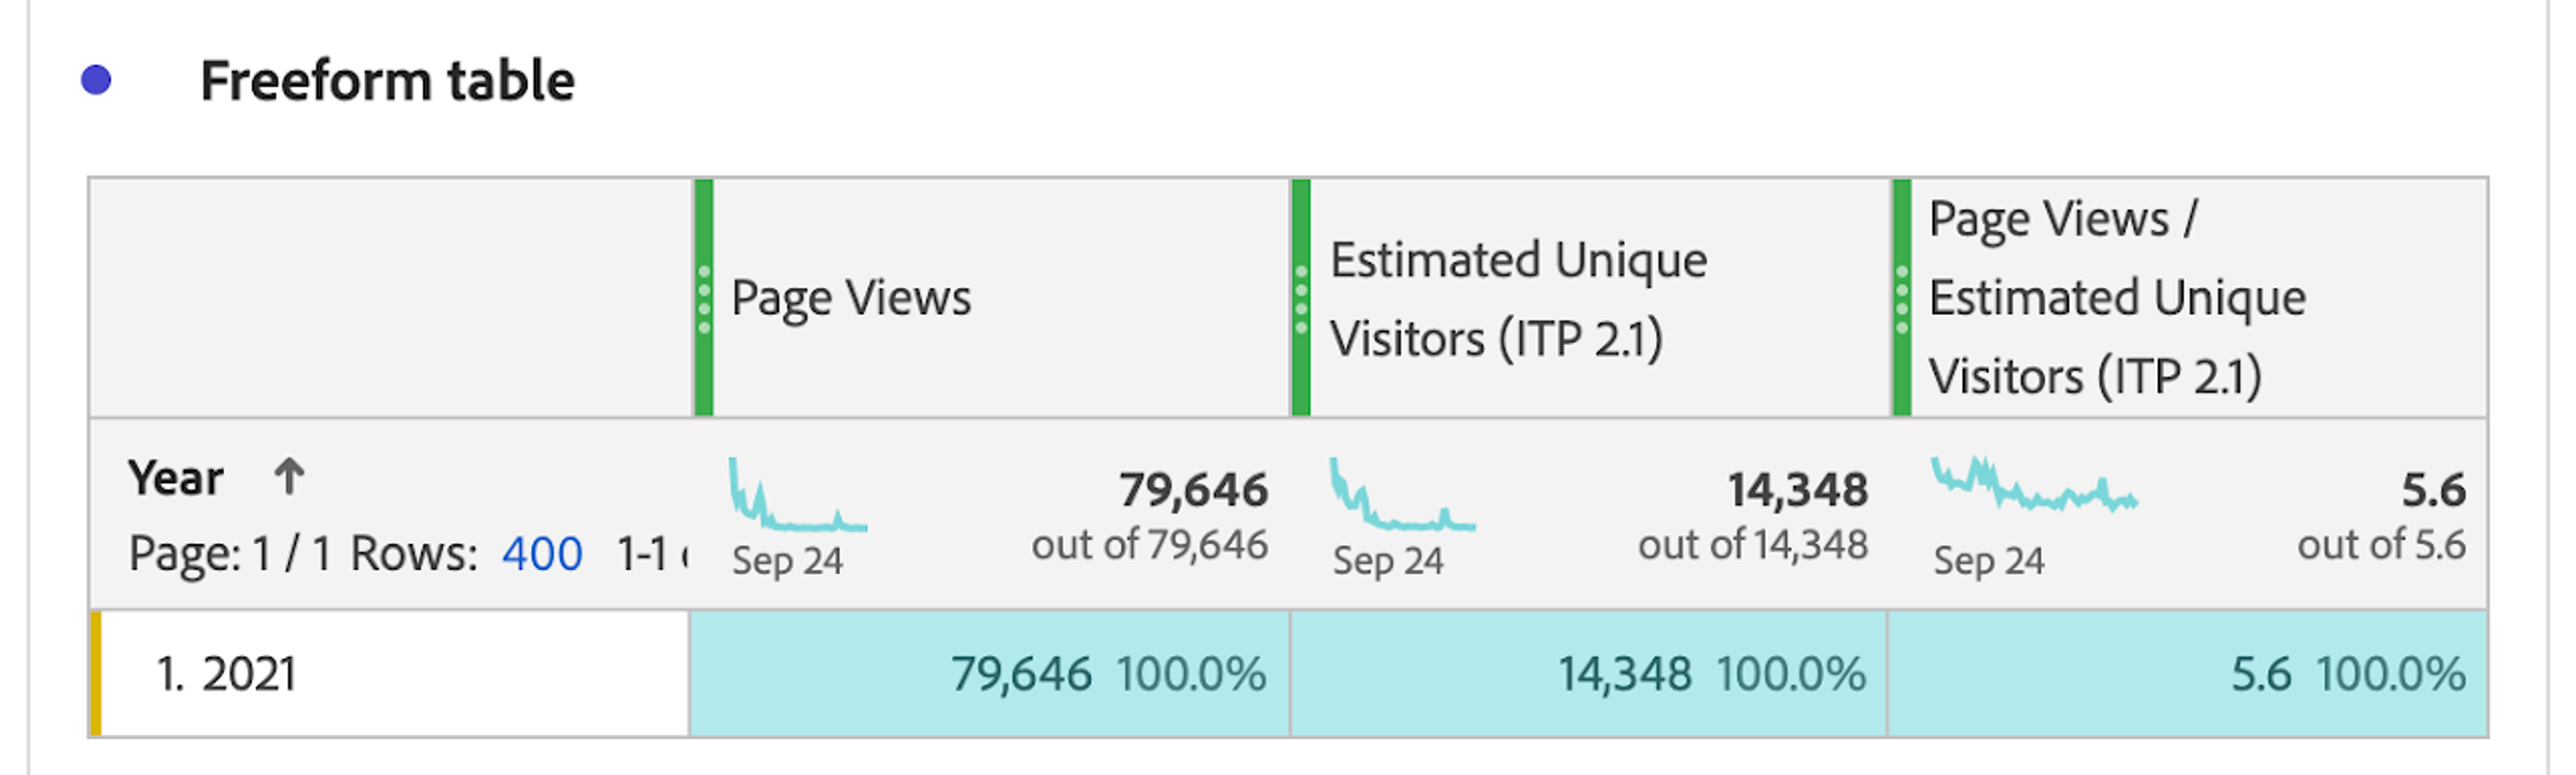
10. The Adjust: Use calculated metrics to adjust for the skew caused by ITP tracking limitations Panel provides you with a framework for building calculated metrics that incorporate adjustments based on the previous analyses. Inspect the way in which the Estimated Unique Visitors (ITP 2.1) and Page Views / Estimated Unique Visitors (ITP 2.1) calculated metrics were created. Instead of using the default denominator of 2, utilize the data within this template to find a static number that aligns with your organization’s unique ITP effect.
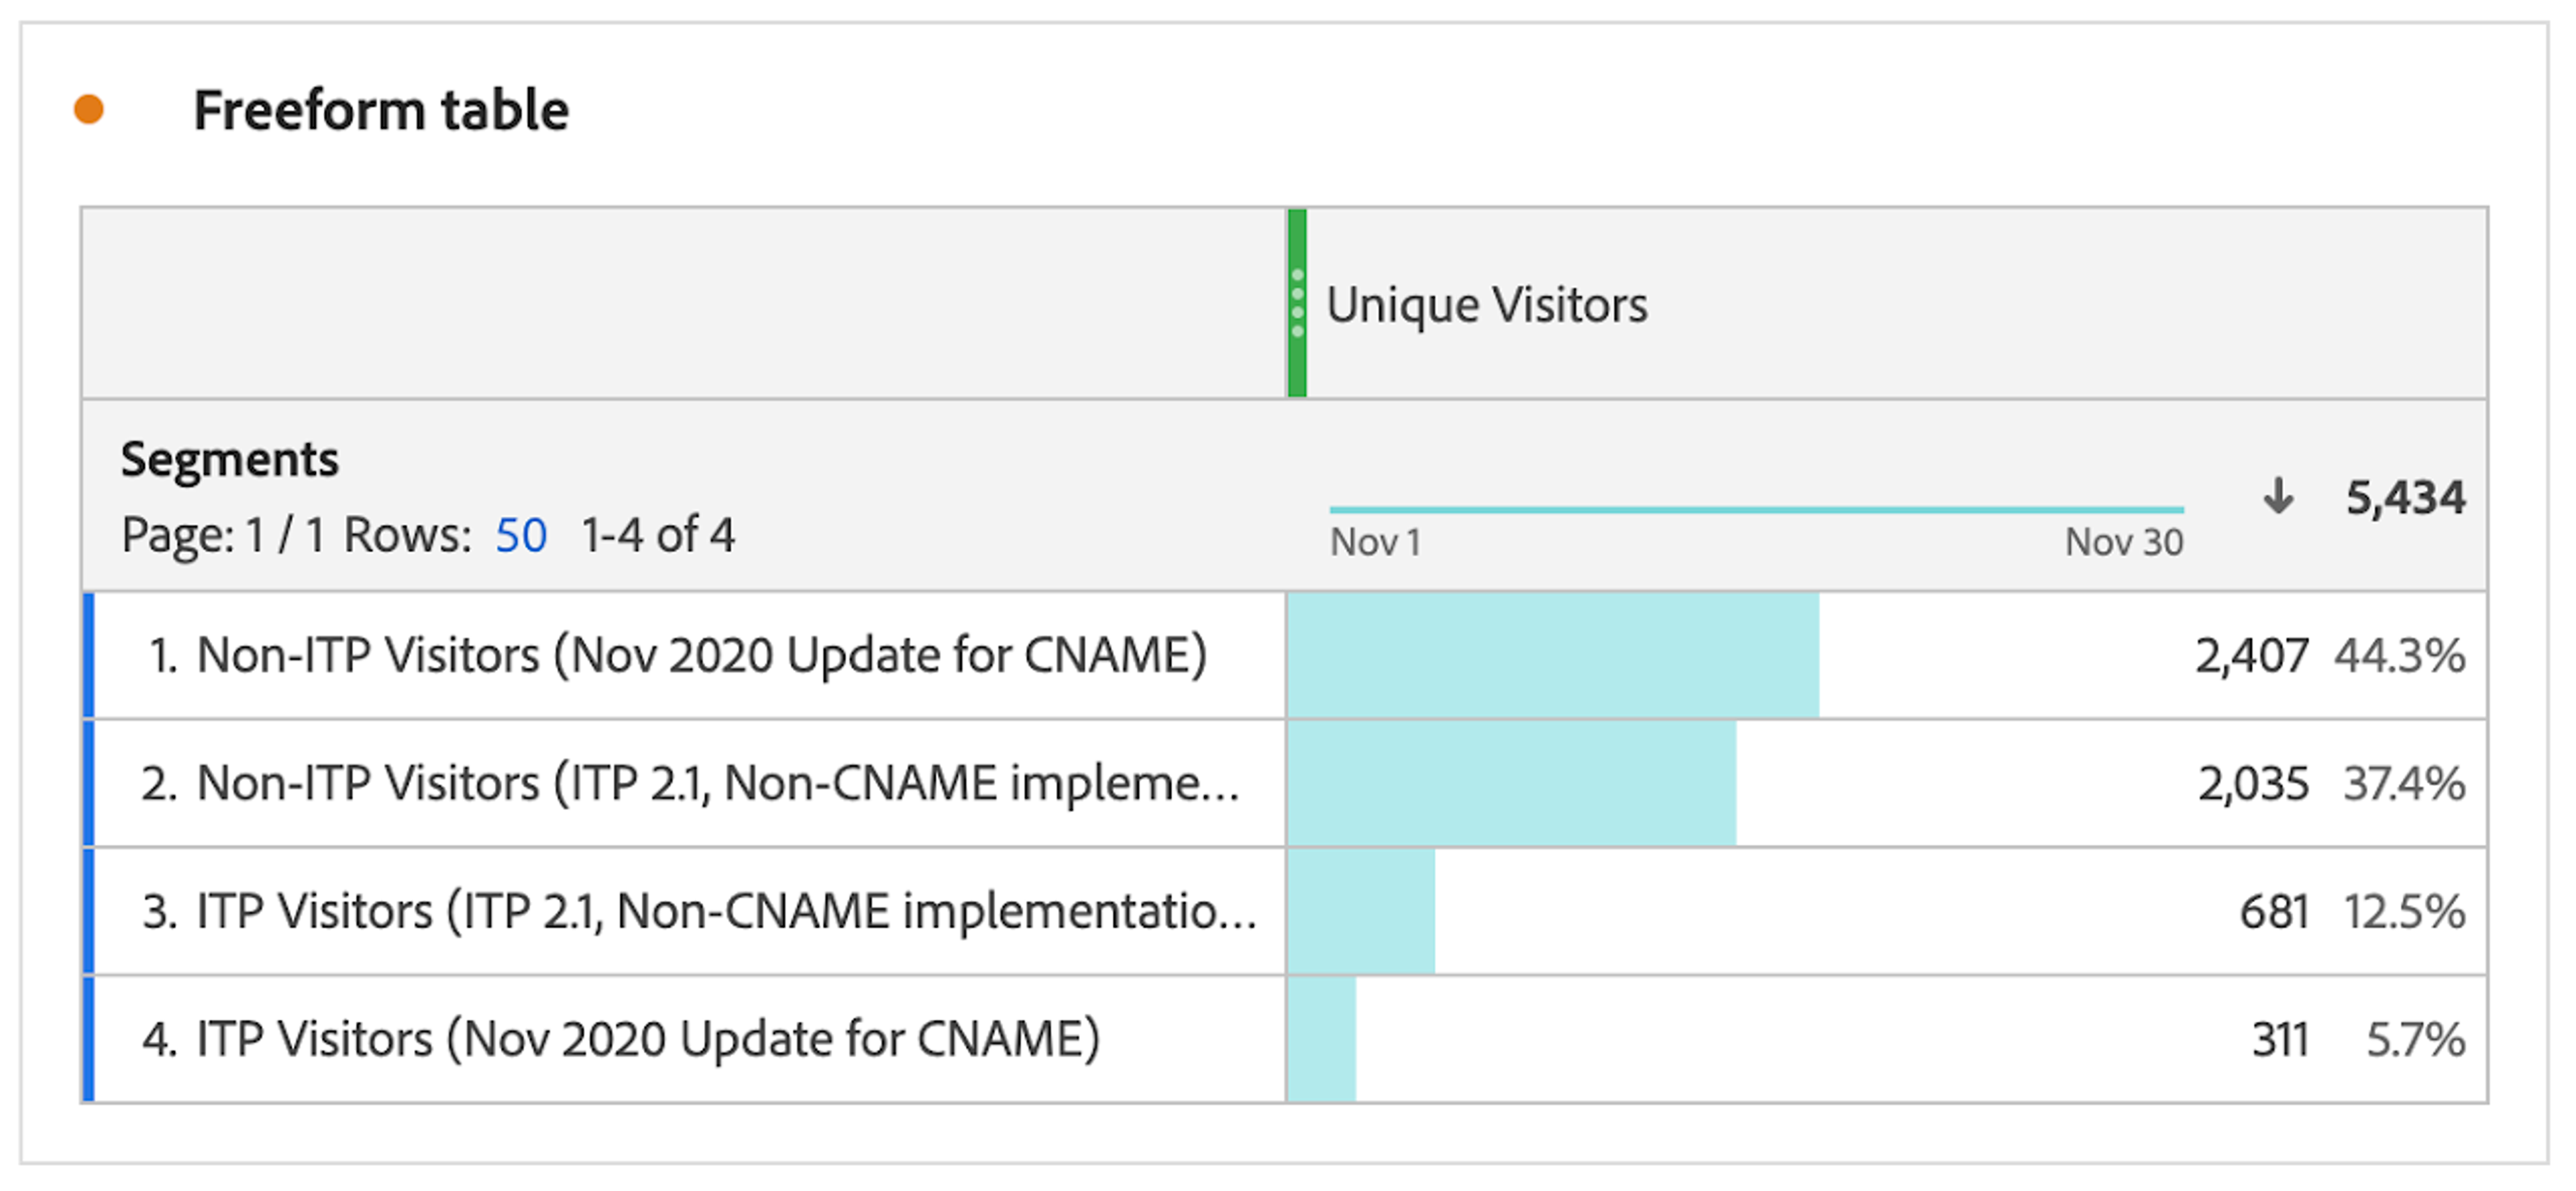
11. The Reference: ITP Segments Panel is to be used exactly as it sounds, as a reference panel. Feel free to use the pre-built Freeform Table to compare and contract the different types of ITP-related Segments that have been built by Adobe.